Learn Slope-Intercept Form (y = mx + b) on The Great Discovery
The slope-intercept form of a line is y = mx + b, where m represents the slope (steepness of the line) and b represents the y-intercept (where the line crosses the y-axis). This form makes it easy to graph linear equations and understand their behavior.
The slope-intercept form of a line is y = mx + b, where m represents the slope (steepness of the line) and b represents the y-intercept (where the line crosses the y-axis). This form makes it easy to graph linear equations and understand their behavior.
Key Takeaways
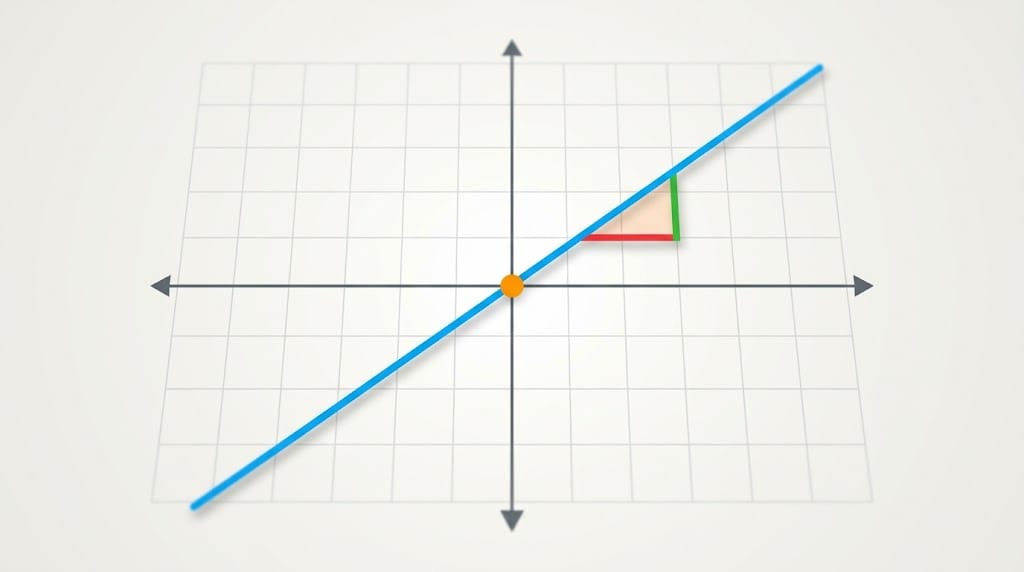
- m is the slope — it tells you how steep the line is and the direction it travels (rise over run)
- b is the y-intercept — the point where the line crosses the y-axis, the starting point for graphing
- Slope-intercept form is the easiest way to graph — start at b on the y-axis, then use m to find other points
- This free course provides structured video lessons — watch, understand, then practice with guided problems
- Master this foundation to unlock advanced math — systems of equations, linear modeling, and algebra all depend on this concept
Table of Contents
- Understanding Slope-Intercept Form
- Key Concepts and Techniques
- Who Benefits from Learning Slope-Intercept Form?
- What Do Students Say?
- About the Creator
- Components of Slope-Intercept Form
- Watch Before You Enroll
- Frequently Asked Questions
- Conclusion
- Explore More on TGD
Understanding Slope-Intercept Form
The slope-intercept form y = mx + b is the most practical way to write and understand linear equations. This form immediately reveals two critical pieces of information about any straight line: its slope (m) and where it crosses the y-axis (b).
The slope m tells you how steep the line is. A slope of 2 means for every 1 unit you move right, the line goes up 2 units. A negative slope means the line goes down as you move right. The y-intercept b is simply the y-coordinate where the line touches the y-axis (when x = 0).
Why does this matter? Slope-intercept form is the gateway to understanding linear relationships in algebra, physics, economics, and data analysis. Once you can write an equation in this form, you can instantly sketch the graph, predict values, and compare different lines. It's the foundation for understanding how variables relate to each other in real-world situations.
Want to Learn Slope-Intercept Form Step by Step?
This free course on The Great Discovery covers all of these fundamentals with video lessons and practice problems designed by an experienced math educator.
Key Concepts and Techniques
Understanding slope-intercept form means mastering three interconnected concepts: the slope, the y-intercept, and how to translate between equations and graphs.
The Slope (m)
The slope tells you the rate of change. If m = 3, the line rises 3 units for every 1 unit you move right (rise over run). Negative slopes go downward—a slope of -2 means the line drops 2 units for every 1 unit right. A slope of 0 is a horizontal line (no change), and an undefined slope indicates a vertical line.
The Y-Intercept (b)
This is where the line crosses the y-axis. To find it, substitute x = 0 into y = mx + b and you get y = b. This point is always at (0, b), making it your natural starting point for graphing any line. If b = 5, your line crosses the y-axis at the point (0, 5).
Writing Equations from Two Points
If you have two points on a line, you can find the slope using m = (y₂ - y₁)/(x₂ - x₁). Once you have m, use one of your points and substitute into y = mx + b to solve for b. This reverse-engineering process is crucial for converting real data into equation form.
Graphing from an Equation
Start by plotting the y-intercept (0, b) on your graph. Then use the slope to find your next point. A slope of 1/2 means rise 1, run 2—from your y-intercept, move right 2 units and up 1 unit. Repeat this pattern to create your line. This systematic approach eliminates guesswork from graphing.
Real-World Applications
Slope-intercept form models anything linear: a taxi fare of y = 15 + 3x (initial fee plus charge per mile), distance traveled as y = 50 + 60t (starting position plus speed over time), or savings account growth. The slope represents the rate, and the y-intercept represents the starting value. Understanding these equations helps you model and predict real-world phenomena.
Who Benefits from Learning Slope-Intercept Form?
Slope-intercept form is essential for anyone studying algebra, physics, economics, or data analysis—from middle school students to professionals.
Middle and High School Students
This is the core algebra topic that unlocks your ability to graph, solve systems of equations, and progress to advanced mathematics. If you're struggling with it, you're not alone—and that's exactly why the free course exists. The structured video lessons and guided practice problems help you move from confusion to confidence.
Students Struggling with Graphing
If graphing feels intimidating, slope-intercept form simplifies it completely. Instead of plotting random points and hoping for a line, you have a systematic method: start at the y-intercept, then use the slope to find every other point. The course's step-by-step approach makes this click even if past math classes left you frustrated.
College-Bound Students
SAT and ACT math sections test linear equations heavily. Fluency with slope-intercept form means faster problem-solving and fewer careless errors under timed conditions. The course gives you the conceptual understanding and practice needed to handle these questions confidently on test day.
Parents Tutoring Their Kids
If your student is stuck on this topic, watching Dennis DiNoia explain it first gives you a framework to help at home. The course provides the clarity you need to support their learning without frustration on either side.
What Do Students Say?
This course is new to the marketplace and hasn't collected reviews yet. Check back after launch for student feedback.
About the Creator
Dennis DiNoia (known to students as Mr. D) has created 12 courses on The Great Discovery with a 5.0 average rating. His approach focuses on breaking down complex math concepts into understandable, teachable segments. With his background as a mathematics educator, he designs courses that work whether you're seeing material for the first time or need a refresher.
Creator Stats:
- Total Courses: 12
- Average Rating: 5.0/5.0
- Teaching Philosophy: Clear explanations + practical practice problems
Explore Dennis DiNoia's Other Courses →
Components of Slope-Intercept Form: What Each Part Does
Every equation in slope-intercept form reveals its behavior immediately. The table below shows real examples and what each component tells you about the line.
| Equation | Slope (m) | Y-Intercept (b) | What This Means |
|---|---|---|---|
| y = 2x + 3 | 2 | 3 | Line rises 2 units for every 1 unit right, crosses y-axis at 3 |
| y = -x + 5 | -1 | 5 | Line falls 1 unit for every 1 unit right, crosses y-axis at 5 |
| y = 0.5x - 2 | 0.5 | -2 | Gentle slope, rises 0.5 units for every 1 unit right, crosses y-axis at -2 |
| y = 4x | 4 | 0 | Steep slope, crosses at the origin (0, 0) |
| y = -3x + 1 | -3 | 1 | Steep negative slope, crosses y-axis at 1 |
| y = 7 | 0 | 7 | Horizontal line (no slope change), crosses y-axis at 7 |
By studying these examples, you can instantly recognize the behavior of any linear equation. Once this becomes automatic, graphing, solving systems, and modeling real-world situations become straightforward applications of a concept you truly understand.

Master Slope-Intercept Form with Expert Guidance
Dennis DiNoia's course covers all of these concepts and more, with structured video lessons and practice problems you can complete at your own pace. Start with the fundamentals and build toward confident application.
Watch Before You Enroll
Watch this short video overview to understand the main ideas behind The slope-intercept form of a line y = mx + b - Micro Course before you enroll.
This video introduces The slope-intercept form of a line y = mx + b - Micro Course and previews discover how it works and what each letter means in the equation y = mx + b.
Frequently Asked Questions
What does m represent in y = mx + b?
The variable m represents the slope of the line, which is the rate of change. It tells you how much y changes for every unit change in x, expressed as rise over run. A positive slope goes upward; a negative slope goes downward.
What is the y-intercept and why does it matter?
The y-intercept (b) is where the line crosses the y-axis. It's the value of y when x = 0. It matters because it gives you a starting point for graphing and tells you the initial value in real-world situations (like a taxi's initial fee before adding distance charges).
How do I find the slope if I have two points on a line?
Use the slope formula: m = (y₂ - y₁)/(x₂ - x₁). Subtract the y-coordinates and divide by the difference in x-coordinates. This fraction represents your rise over run, which is the slope.
Can a line have a negative slope?
Yes. A negative slope means the line goes downward from left to right. For example, if m = -2, the line drops 2 units for every 1 unit you move right. Negative slopes model decreasing relationships like temperature drop over time or distance to a destination as you approach it.
How is slope-intercept form different from other forms of linear equations?
Slope-intercept form (y = mx + b) is the most intuitive for graphing because m and b are immediately visible. Standard form (Ax + By = C) and point-slope form are useful for different situations, but slope-intercept form is best when you need to quickly graph a line or understand its behavior.
Is this free course really free, or are there hidden costs?
This course is completely free on The Great Discovery. There are no hidden fees, premium content upsells, or restrictions—just high-quality video lessons and practice problems taught by Dennis DiNoia.
Conclusion
You've learned that the slope-intercept form y = mx + b is the most practical way to understand and graph linear equations. The slope m reveals how steep the line is, while the y-intercept b shows where it crosses the y-axis. This foundation unlocks your ability to analyze relationships between variables and progress confidently through algebra.
Dennis DiNoia's free course takes this deeper with structured video lessons and practice problems that build true mastery. Whether you're encountering this material for the first time or refreshing your knowledge, the course guides you step-by-step until you can confidently write equations, graph lines, and apply the math to real-world problems.
Explore More on TGD
Ready to expand your math knowledge? The Great Discovery offers courses across algebra, geometry, calculus, and more.
- Explore Academic Learning Courses
- Browse Kids Content Courses
- Explore More Courses by Dennis DiNoia
- Visit The Great Discovery Home
Share Your Knowledge on The Great Discovery
Join Dennis DiNoia and hundreds of other creators sharing their expertise. Create and sell your own courses on TGD.